Run a local market comparison with AI

Use free AI tools like Perplexity to scan nearby urgent cares, compare services, and uncover where you can stand out.

Run your first search

Why it matters

Understanding your local market helps you grow smarter. In just 15 minutes, you’ll be able to spot service gaps, identify standout hours or offerings, and uncover expansion opportunities in your area.

Use AI to quickly get the lay of the land — so you know exactly where you’re ahead and where you’ve got room to grow.

Who it's for

Clinic Owners

See how your services and hours stack up — and where there’s opportunity to expand or differentiate.

Operations Teams

Benchmark services, hours, and workflows across local competitors to improve performance.

Marketing Teams

Find white space in your market and build campaigns around what makes your clinic stand out.

How It Works

1
Search your area in Perplexity
Google and Facebook review dashboards
Instructions:
  • Go to perplexity.ai
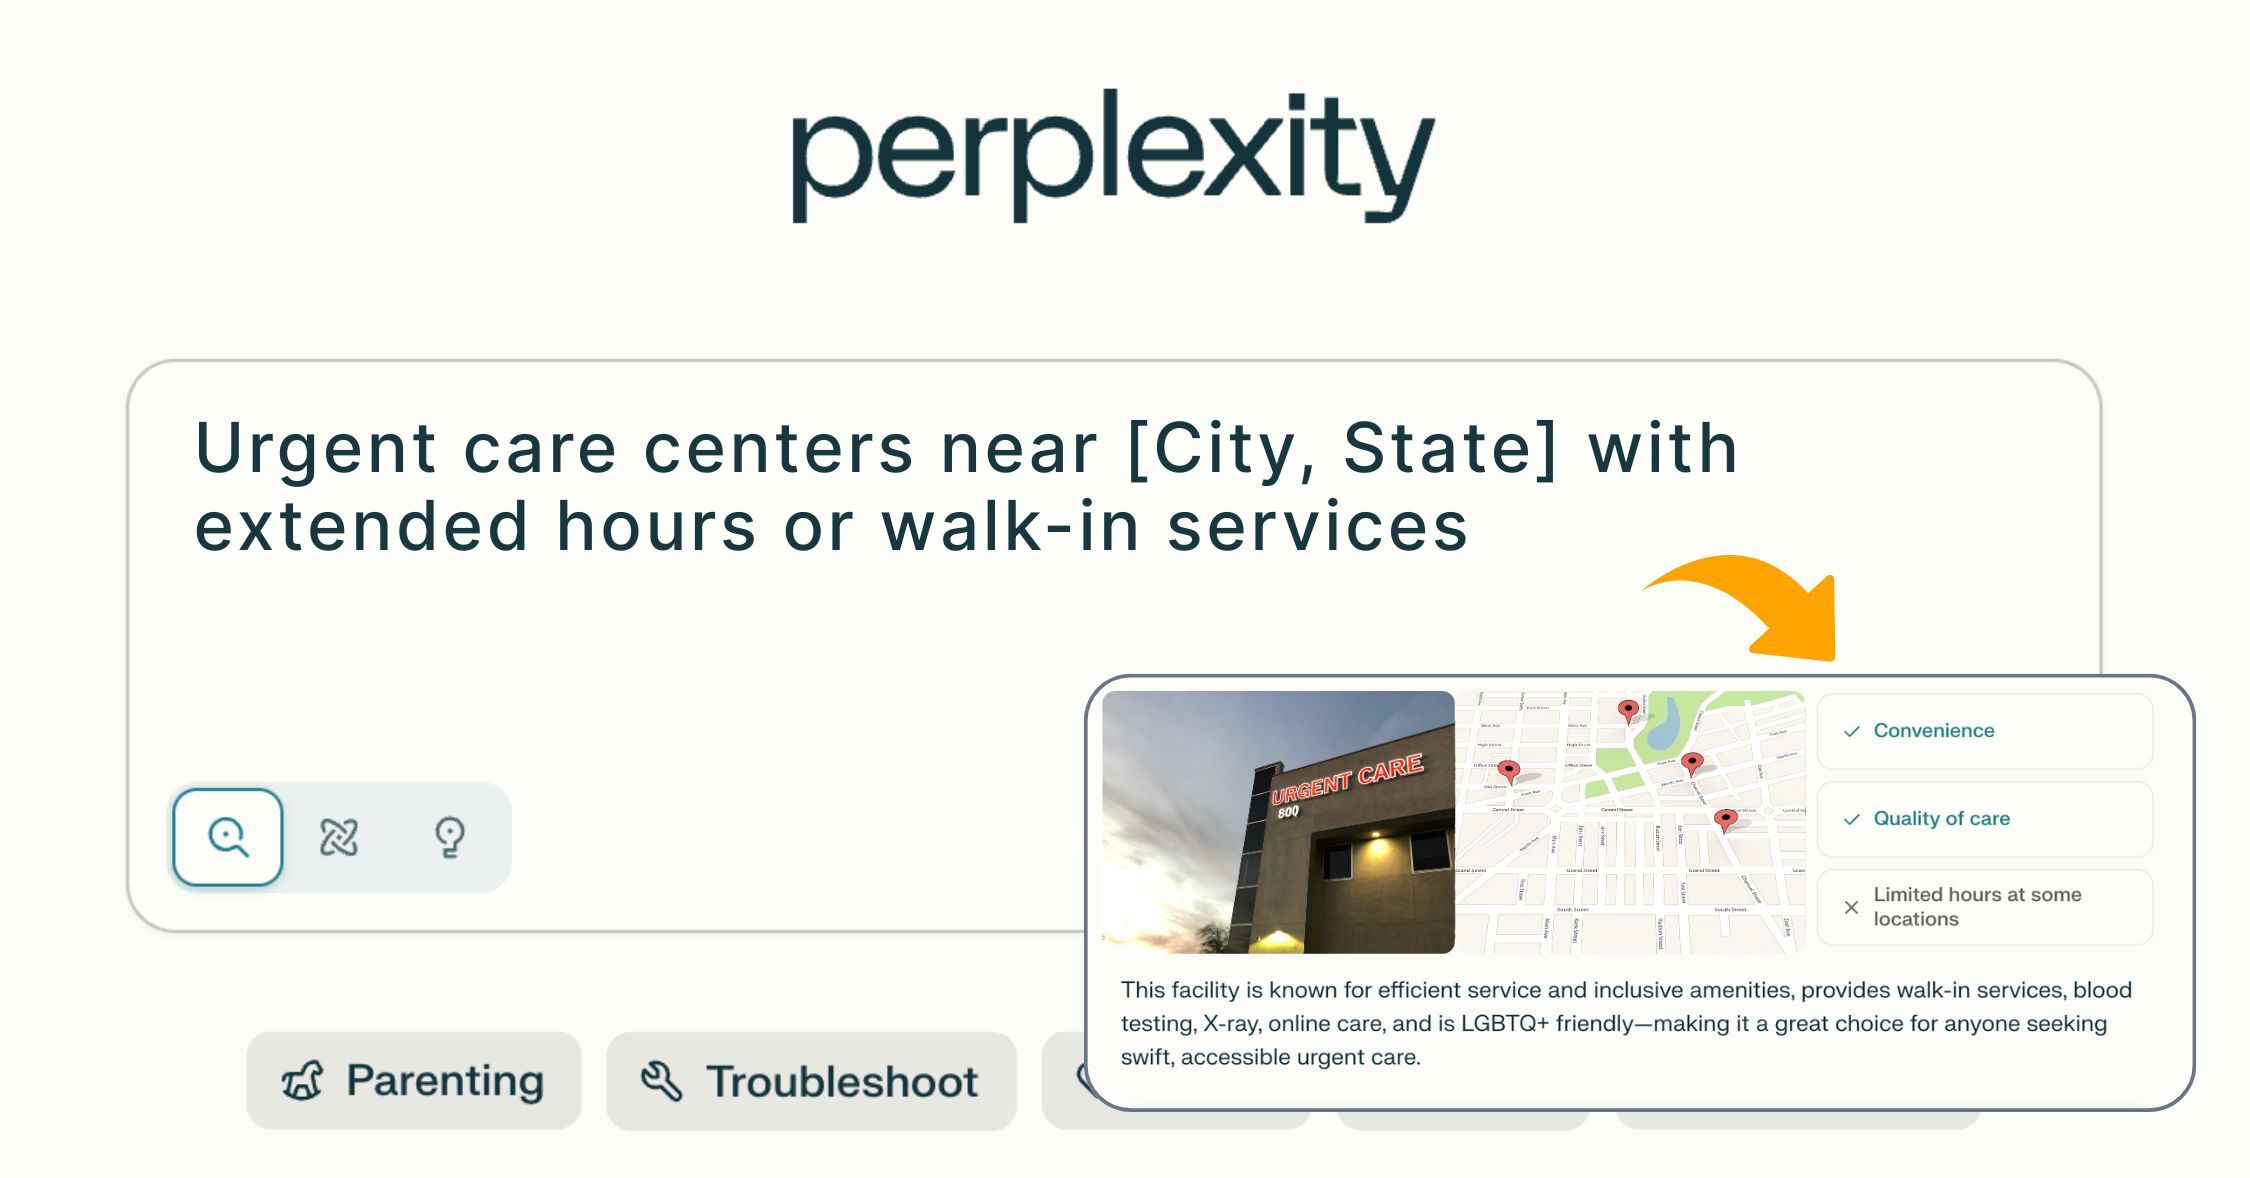
  • Search: “Urgent care clinics near [your city] with extended hours or walk-in services”
  • Start scanning results, location by location.
Pro Tip: Add filters like “Open weekends” or “Offers virtual care” to dig deeper.
2
Use strategic prompts to extract insights
Google and Facebook review dashboards

Begin with this prompt:

Compare services, hours, and pricing for the top 5 urgent care clinics in [City Name].

More ways to get started:

What are the most common services offered by urgent care clinics in [region]?
Which urgent care clinics in [City] advertise virtual visits or extended hours?
Based on local listings, what competitive gaps exist in urgent care services in [area]?

Visual outputs you can create

Use these prompts to generate competitive visuals like tables, heat maps, charts, and rating grids — not just bullet points.

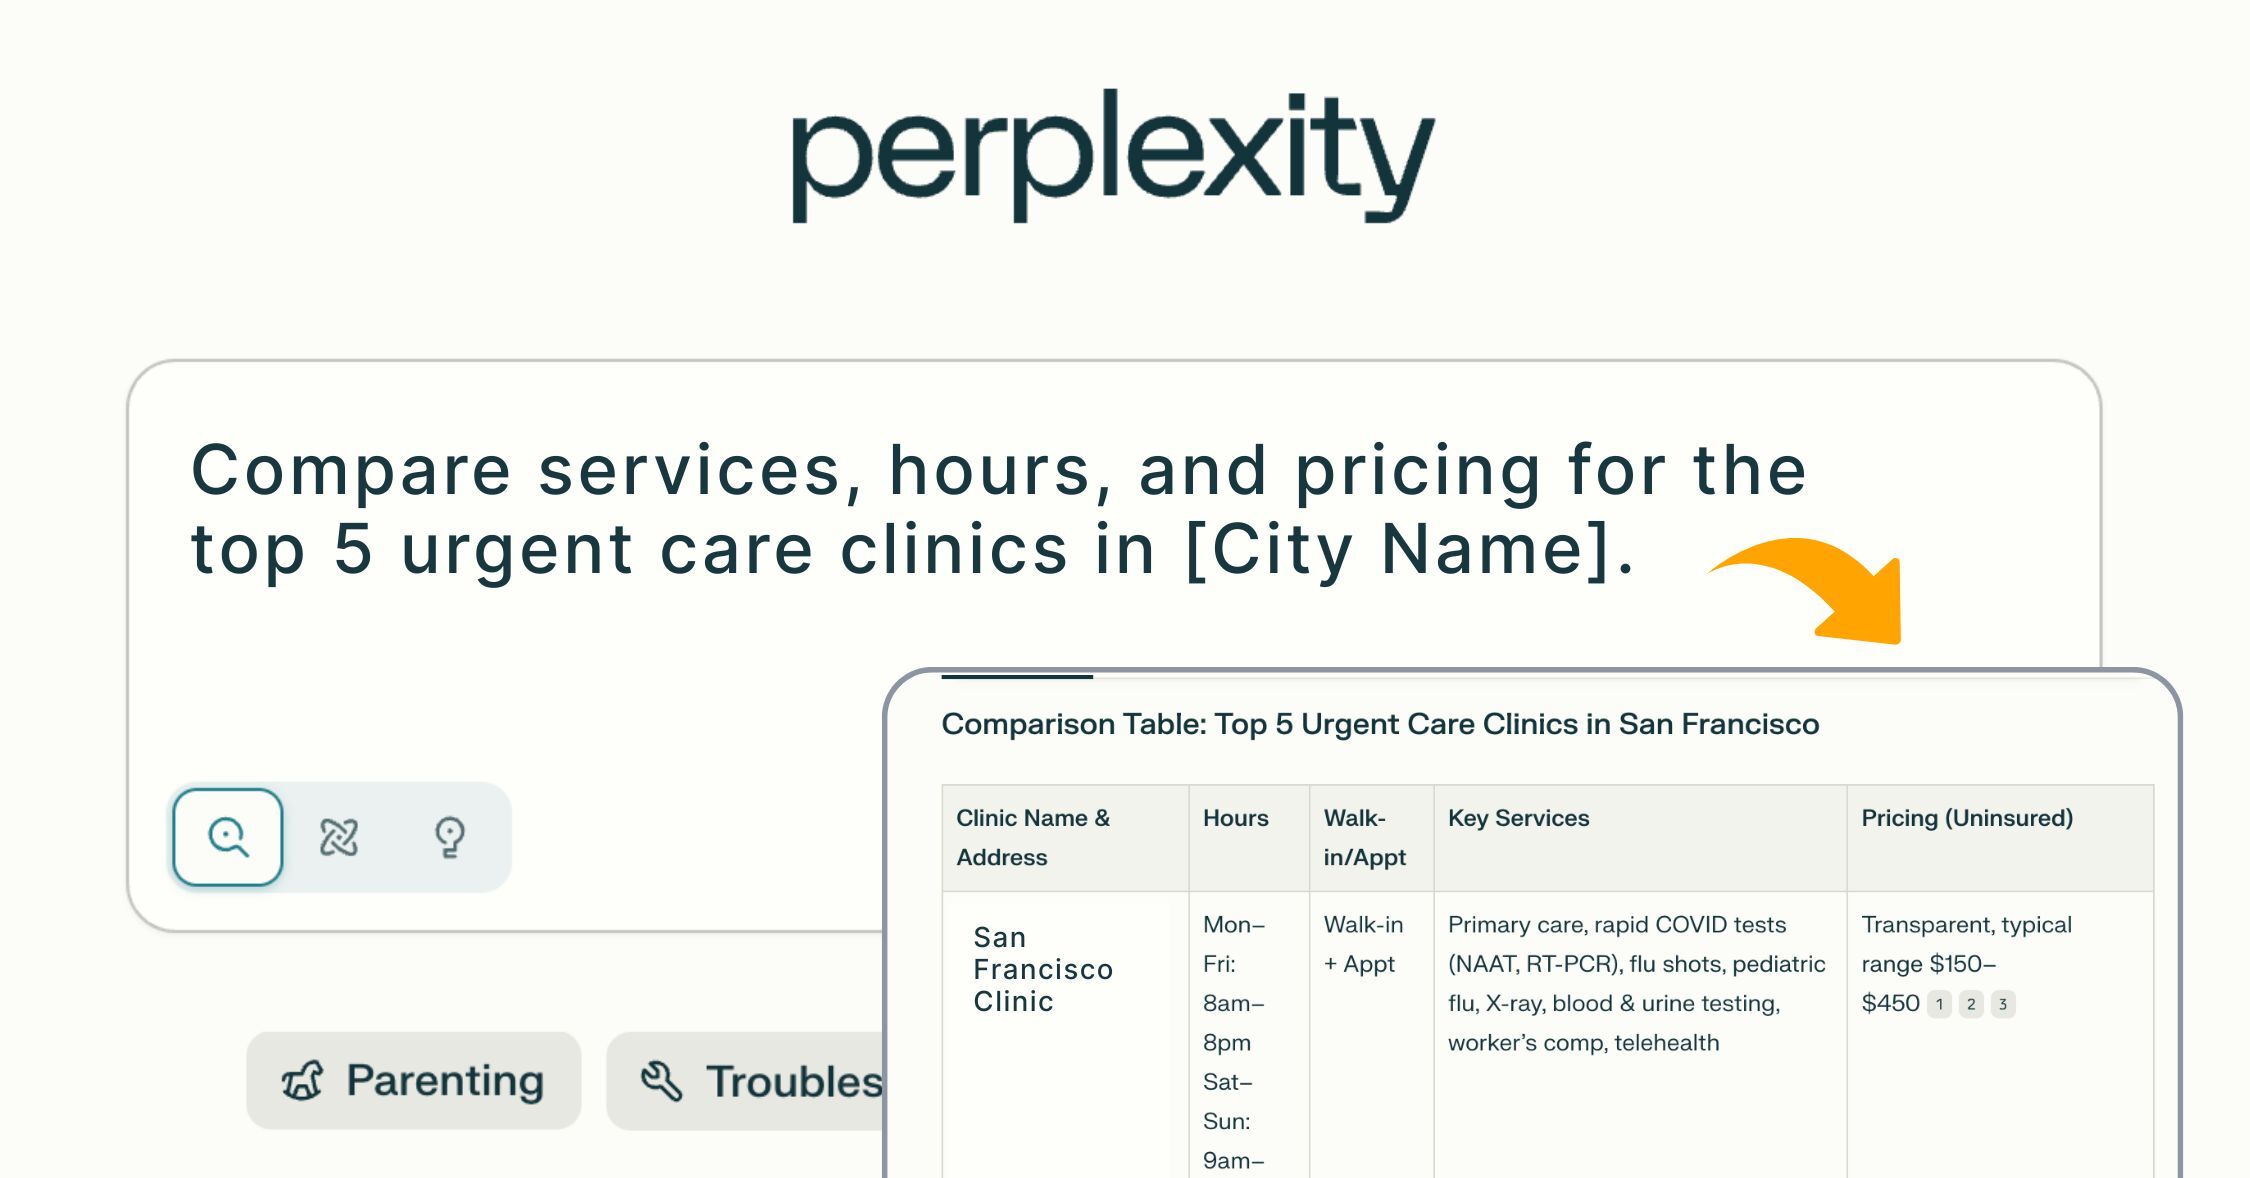
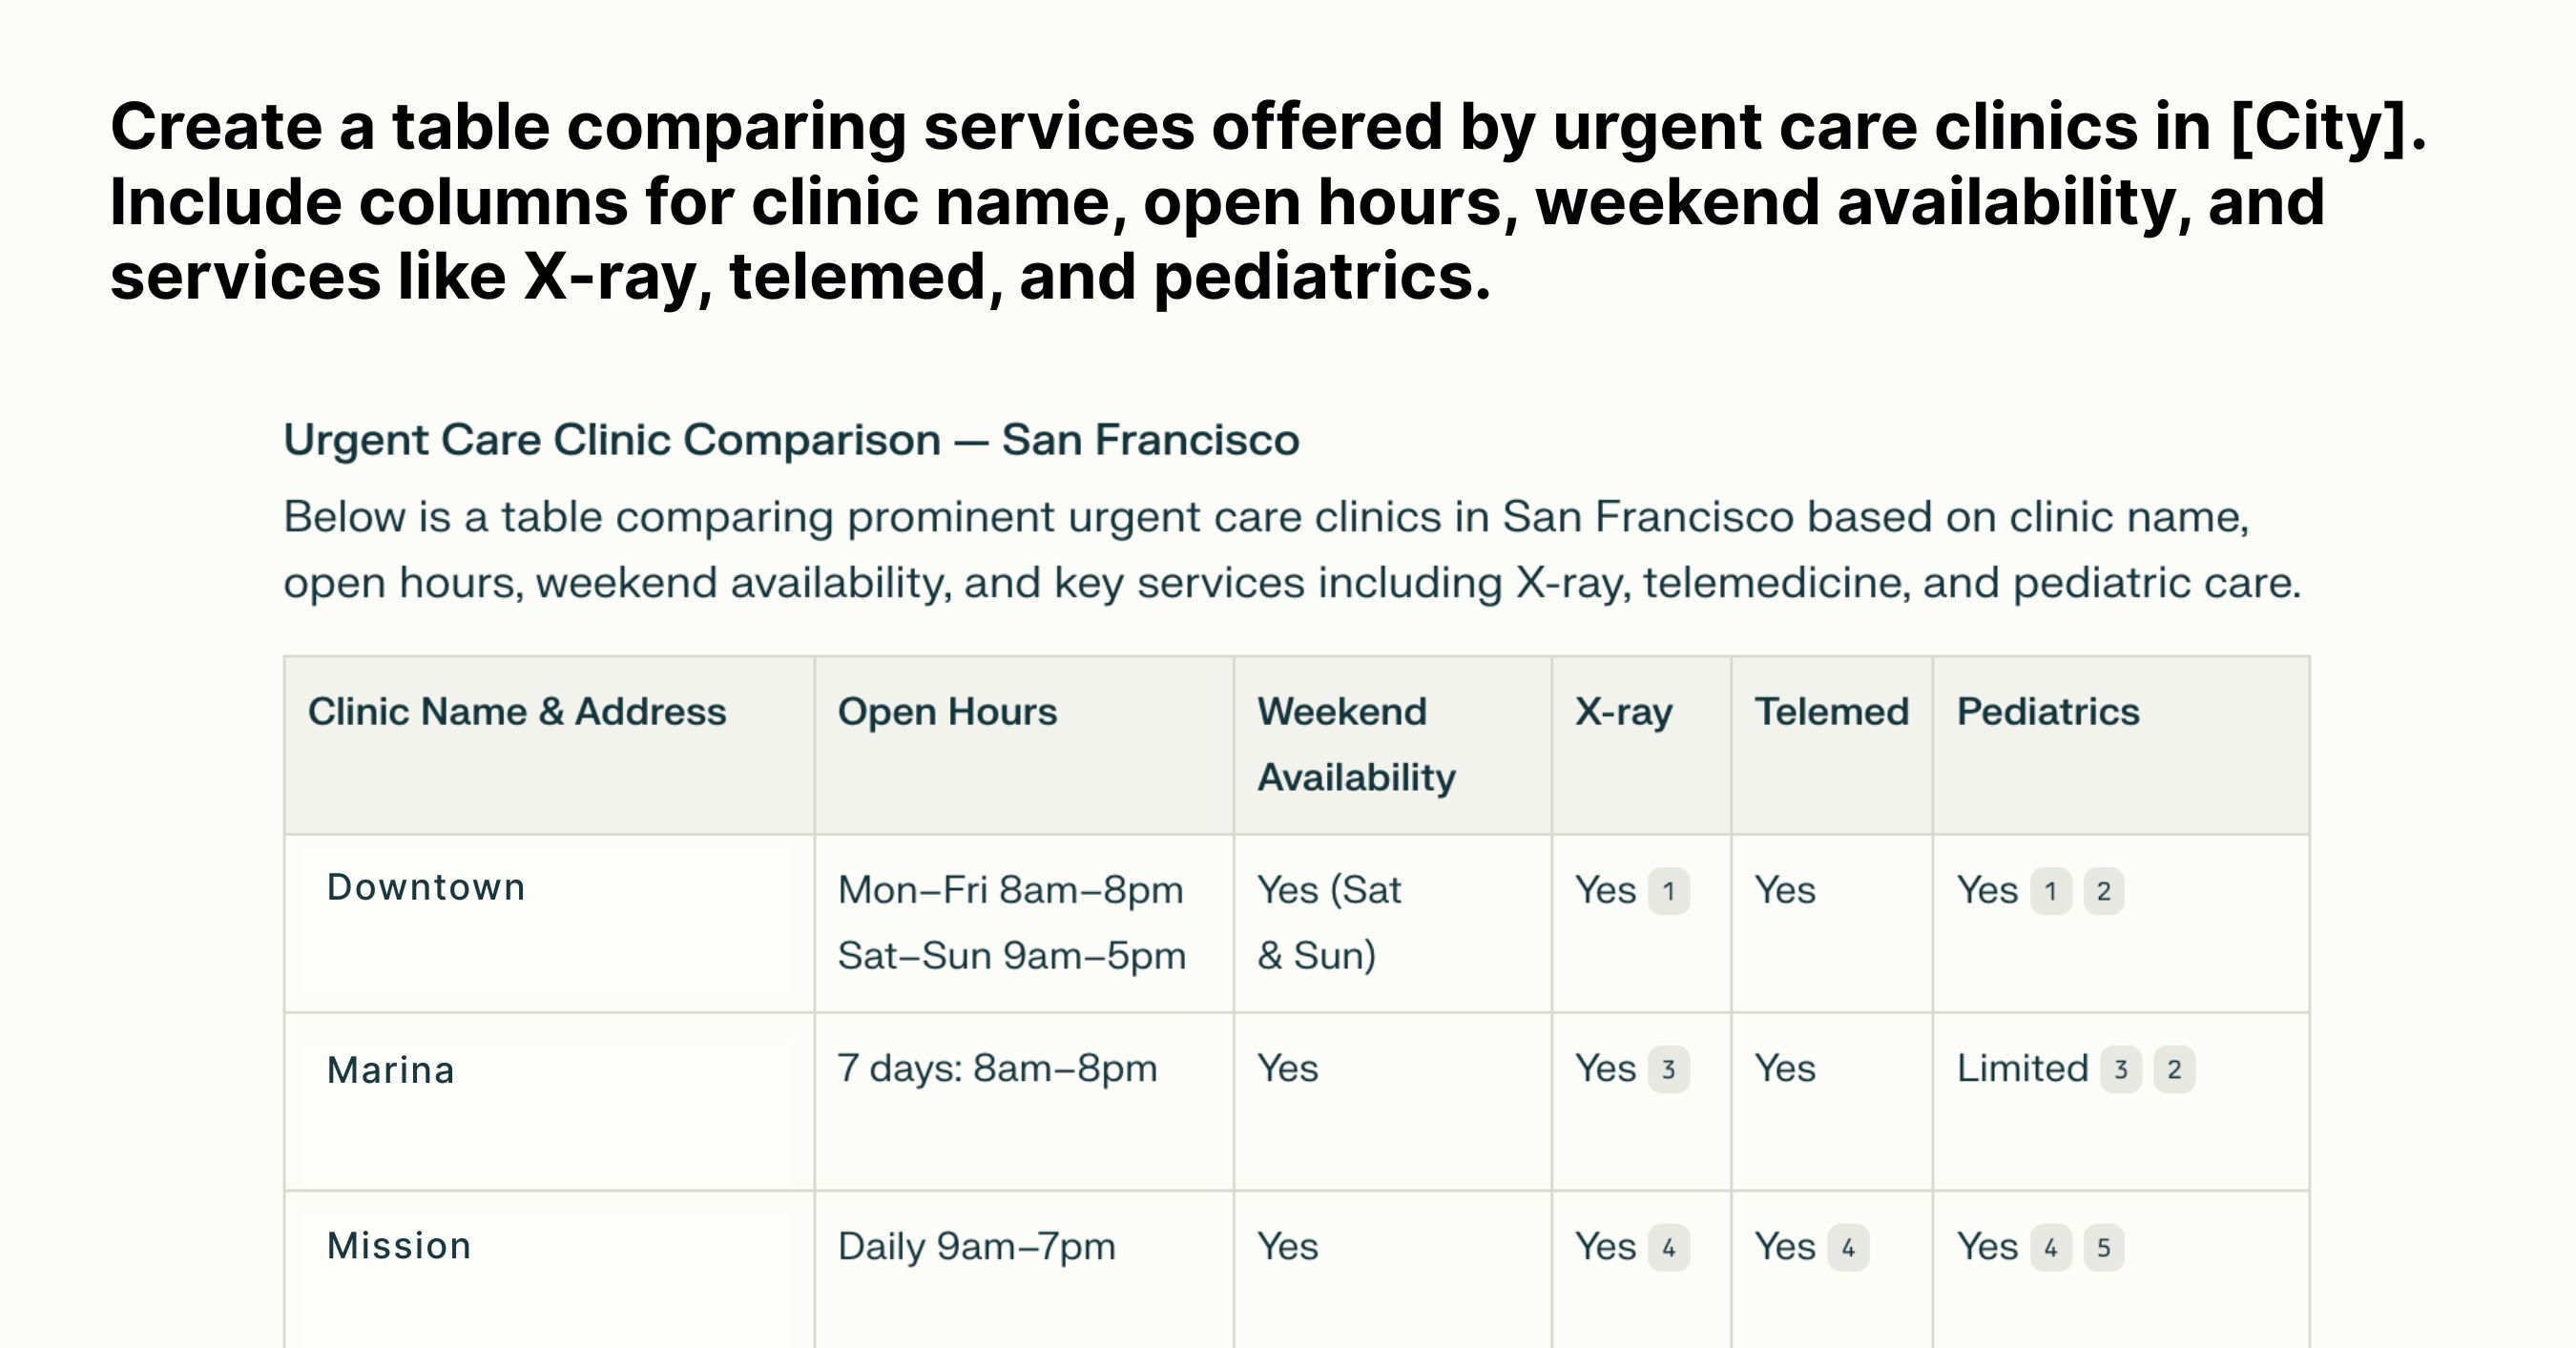
Compare services side-by-side

Get a table view of nearby clinics by name, hours, weekend access, and special services.

Create a table comparing services offered by urgent care clinics in [City]. Include columns for clinic name, open hours, weekend availability, and services like X-ray, telemed, and pediatrics.

Find coverage gaps by ZIP code

Map out clinics by ZIP and spotlight areas with limited access or no weekend hours.

List all urgent care clinics in [County] by ZIP code, and estimate the density of services. Highlight ZIPs with the fewest options.

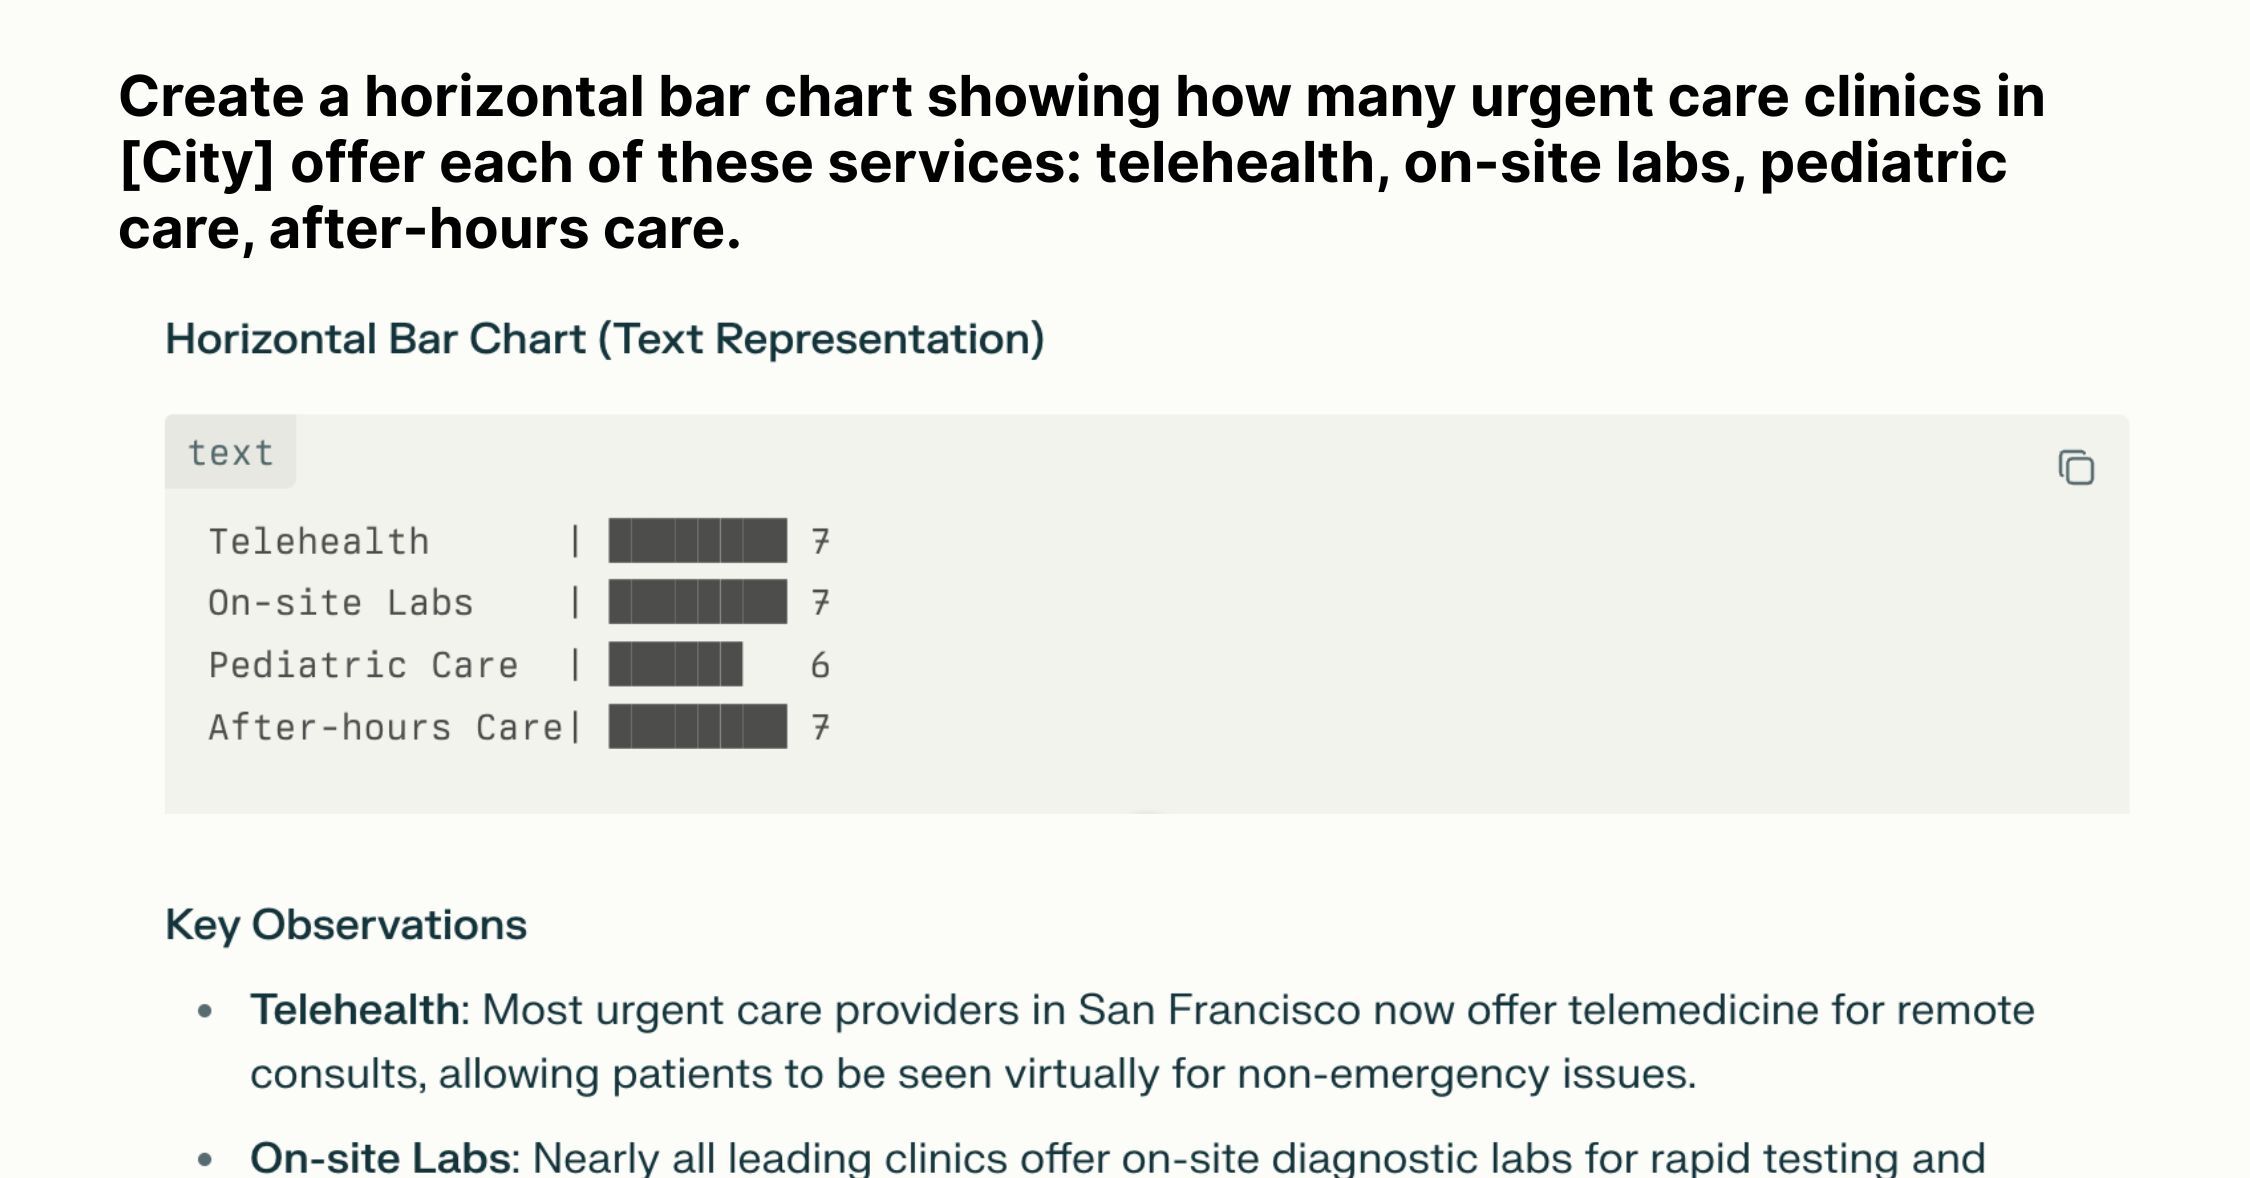
Visualize local service availability

Turn your market scan into a bar chart showing which services are most or least common.

Create a horizontal bar chart showing how many urgent care clinics in [City] offer each of these services: telehealth, on-site labs, pediatric care, after-hours care.

Radar chart of competitive position

Rate yourself vs competitors across six dimensions: service, sentiment, accessibility, and more.

Rate [Your Clinic Name] and top 3 competitors across 6 dimensions: wait times, services, hours, pricing, patient sentiment, accessibility. Format as a radar chart.
3
Examples of outputs using advanced prompts
Google and Facebook review dashboards
Try these formats:
  • Local services map
  • Service gaps heatmap:
  • Trends comparison chart
  • SWOT-style competitive grid

Make it work for you

  • Find gaps in your hours or service mix
  • Spot early opportunities for growth or marketing
  • Prioritize where to invest in new offerings
  • Understand how your clinic is positioned — and where to win

Power user tips

Check weekly: Run the same query every week or month in Perplexity to spot shifts in hours, services, or positioning.
Zoom in by ZIP code: Search by ZIP or neighborhood to uncover micro-trends—like which services are expanding or contracting.
Tell the story visually:Save screenshots of your results and use them in planning docs or leadership decks to back up your strategy